




 20 slides
View template
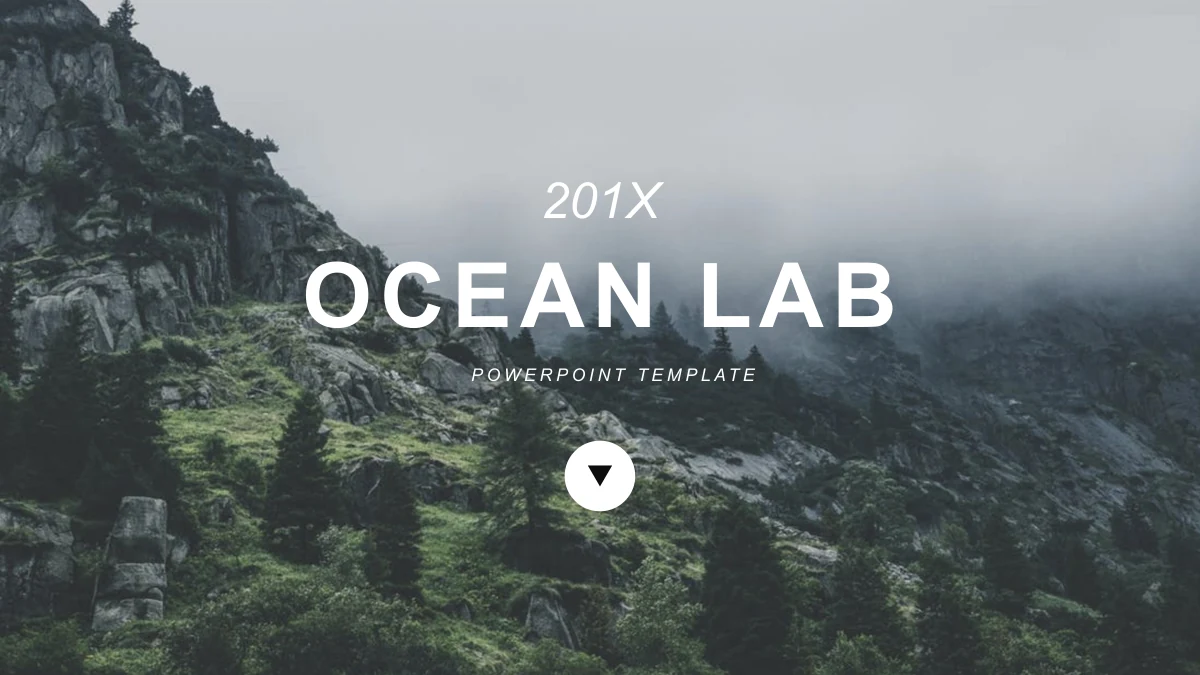
Ocean Lab Presentation Template
20 slides pair outdoor photos with black panels, a numbered grid, three-column comparisons and hexagonal picture cards.
20 slides
View template
20 slides pair outdoor photos with black panels, a numbered grid, three-column comparisons and hexagonal picture cards.
 23 slides
View template
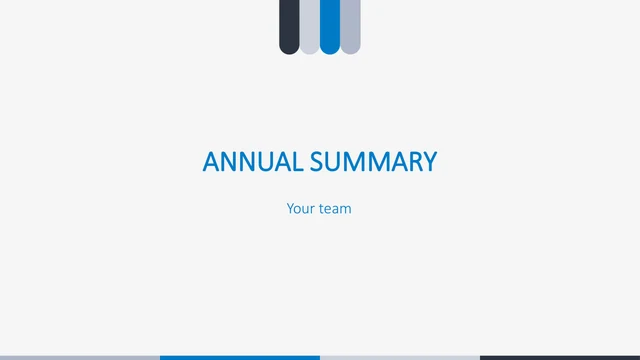
Blue and cyan tabs frame 23 annual-summary slides. Four photo chapters lead into service icons, diagrams, a legacy Excel chart and year milestones.
 28 slides
View template
Yellow and charcoal shapes cut across monochrome city photos. Explore 28 slides with four chapters, editable charts, a five-point timeline and hexagonal photo layouts.
 48 slides
View template
Snowy peaks and blue gradients connect 48 annual report layouts, with three chapters, editable charts, project cards and device frames.
 25 slides
View template
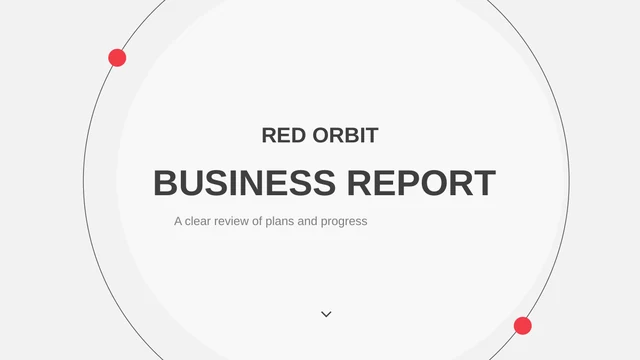
Red and charcoal circles connect four report sections, SWOT, a feature comparison and two editable charts across 25 widescreen slides.
 41 slides
View template
Teal borders connect city photographs, diagonal image panels, photo grids and team profiles across 41 widescreen slides.
 29 slides
View template
Brush-shaped photos frame company, service and project layouts across 29 pages.
 20 slides
View template
An orange clock introduces 20 gray slides with raised circles, four section breaks, a five-part doughnut and photo-based notes.
 14 slides
View template
Navy circles and offset bars frame 14 teaching slides, including photo notes, four chapters, a three-stage sequence and homework circles.
 24 slides
View template
Blue and orange accents connect five teaching chapters across 24 slides. Chapter tabs, method diagrams, a timed lesson sequence and classroom photos organize the sample plan.
 24 slides
View template
Four circular photo dividers organize 24 blue-and-grey teaching slides, with gears, numbered cards, percentage diagrams, photo layouts and an icon collection.
 23 slides
View template
Green corner circles and technology icons frame a yearly work review with percentage layouts, short notes and an editable line chart.